Flow charts are a great way to organize information and make it easy for someone else to understand. They can be used in a variety of different areas including—but not limited to—business projects, science experiments, or even cooking recipes!
What is a Flow Chart?
A flow chart is a diagram used to show a sequence of steps or actions. It can include decision points, cycles, and repetitions.
Flow charts are often confused with organizational diagrams because they look similar. Organizational diagrams show the internal structure of a company or an organization, while flow charts always focus on processes that involve interactions between different groups or individuals.
Benefits of Using Flow Charts
There are many benefits of using flow charts, but some of the most important ones are:
1. They improve communication.
2. They help to clarify complex processes.
3. They can be used to identify potential problems and solutions.
4. They are a great tool for training new employees.
5. They can be used to document procedures.
6. They help to improve productivity.
7. They are a great way to visualize data.
8. They can be used as a planning tool.
9. They can be used to evaluate results.
10. They are easy to update and amend.
11. They help to prevent mistakes from happening.
12. They are a great way to keep track of your progress.
Are There Any Disadvantages When Using Flow Charts?
There are a few disadvantages when using flow charts. Some of these include:
1. They take time to make, especially when they are more complex.
2. They can be difficult for some people to understand if they don’t have any experience in how to use them.
3. It can be hard for someone without much knowledge of the process being diagrammed to decipher what is happening.
4. They can be quite messy and cluttered, which can make them difficult to read.
How to Use Flow Charts
Now that you know some of the benefits of using flow charts, let’s take a look at how to create them. The following steps will help you get started:
1. Decide what you want to diagram.
2. Draw a basic flow chart outline.
3. Add in the steps involved in the process.
4. Indicate the decision points and loops.
5. Label the different sections of your flow chart.
6. Check for errors and make amendments as necessary.
7. Print out your flow chart and use it as a reference.
By following these steps, you will have a great-looking flow chart that is easy to understand and helps others to better comprehend the information you are trying to share!
12 Tips on How To Use Flow Charts for Your School Project
1. When creating a flow chart, always start with a title that describes the process you are diagramming.
2. Use clear and concise labels for all of your boxes and arrows.
3. If you have a lot of information to include, you may want to use a more complex flow chart with decision points and loops.
4. If there is too much information for one flow chart, you can create multiple flow charts that interact with each other as needed.
5. You can use color and images as long as they fit in with your overall flow chart design and do not distract from the information you are trying to convey.
6. Once you have created your flow chart, check for errors and make amendments as necessary.
7. You can include details such as images or links to further explain any complicated processes in your process descriptions if needed.
8. Print out your flow chart and use it as a reference when needed.
9. Don’t forget to delete any unnecessary steps if you think they are unnecessary!
10. Remember that it is okay to use variations of your original flow chart as long as the information stays the same.
11. Use various sizes of boxes for different types of processes (i.e., decision points should be larger than the regular steps).
12. You can create a flow chart using software or a piece of paper and a pencil.
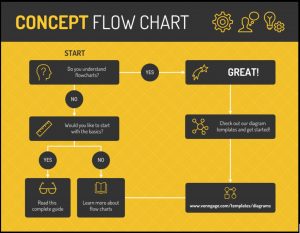
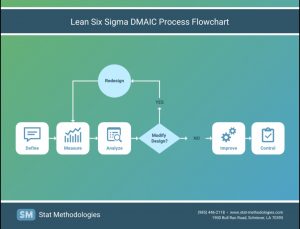
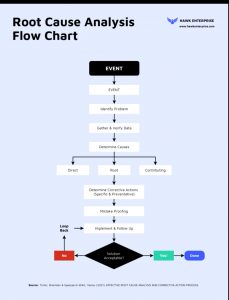
One bonus tip is to use Venngage—an online flow chart maker that provides a vast display of free flow chart templates for everyone. Here are some process flow chart examples from their website!
Flow charts are a great tool for improving communication and providing a visual representation of complex processes.
If you’re stuck on how to communicate your ideas, if the process is complicated or if you simply want to make sure that everyone understands what they need to do from start to finish, flow charts can be an excellent solution.
The tips we have provided should help get you started creating these diagrams with confidence—if all else fails, don’t forget to use Venngage.
What are you waiting for? Make your own flow chart and present the best school project ever!